Giant-virus signals coincided with lower photosynthesis in 87 lakes
A European lake survey found a striking pattern at the base of the food web; a separate virus experiment helps show what the pattern can and cannot mean.
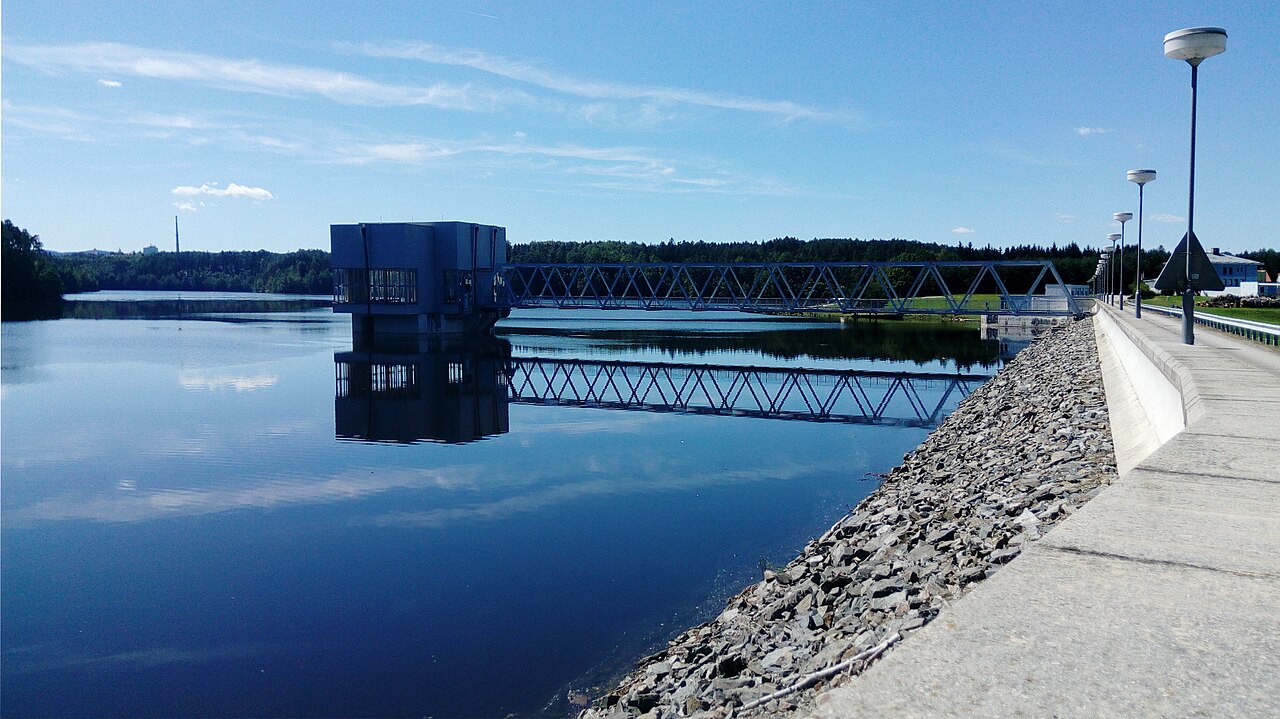
Czeva · Source · CC BY-SA 4.0

A lake with more giant-virus genetic material may also be making much less food at the base of its food web. That is the striking association researchers found across 87 European lakes. Microscopic organisms that photosynthesize feed lake animals directly or indirectly, so a change in their output matters well beyond the invisible world where the viruses live. The survey, though, cannot tell us whether the viruses caused that change.
The sampled lakes stretched from southern Italy to northern Norway. The researchers reconstructed 208 giant-virus genomes from their samples, including 205 that they identified as putative new species. They also proposed 33 links between viruses and possible hosts. On average, the viruses’ relative abundance was nearly three times as high in southern lakes as in northern ones. Lakes with more abundant and more varied giant-virus signals tended to have several-fold lower gross primary production.
That last measure is the amount produced through photosynthesis before the producers use some of it themselves through respiration. It offers a reading of activity near the food web’s starting point: phytoplankton make food that reaches other aquatic animals. It does not measure how much food reaches fish. Nor does gross production, by itself, tell us whether a lake stores more or less carbon overall; respiration and other carbon flows matter to that question.
There is another gap between the survey’s measurements and the tempting explanation. Reconstructing a viral genome establishes a genetic signal in a lake sample. Proposing a host identifies a possible target. Neither amounts to observing those viruses infecting hosts across the 87 lakes, much less measuring how much photosynthesis any infection removed. The survey’s authors also identified differences in light, resources, lake depth, organic matter and potential host communities that help shape where the viral signals appear.
A separate study at a Czech reservoir shows what stronger evidence for one infection looks like. Researchers exposed cultures of Rhodomonas lacustris, a single-celled photosynthesizer, to virus-containing lake water and isolated a giant virus they called Budvirus. The exposed cultures lost pigment and cell numbers fell. Cultures of four other tested kinds of cryptophyte did not collapse after inoculation. Under those tested conditions, the result connects a virus with damage to a susceptible host; it does not establish that every cryptophyte, or every lake, responds the same way.
The researchers also followed a spring bloom in the reservoir. Budvirus genetic material became more abundant as Rhodomonas declined. That sequence fits the possibility that infection helped bring the bloom down, but two changes moving together in lake water cannot, on their own, establish the cause. The culture experiment and the reservoir record answer different parts of the question. The European survey asks where viral signals and photosynthetic output occur together; the culture work demonstrates what one virus can do to one host under controlled conditions.
Viruses are also entering a lake system shaped by other influences. An independent analysis of 58 temperate lakes found that nutrients and colored dissolved organic matter help explain primary production. That analysis does not explain the 87-lake pattern, but it gives concrete reasons to be cautious about assigning the entire difference to viruses.
To find out whether infections help drive the European pattern, researchers would need repeated measurements in the same lakes: which host cells are present, which are infected, how viral populations change, how much photosynthesis occurs, and what happens to light, nutrients and dissolved organic matter at the same time. For now, the survey identifies an important relationship to investigate. Budvirus shows why the question is plausible—and why a genetic signal is only the beginning of an answer.
What the two studies can tell us

Across 87 lakes, stronger giant-virus genetic signals occurred alongside lower gross primary production, but the survey did not establish that infection caused the difference. In a separate culture experiment, Budvirus exposure was followed by pigment loss and falling cell counts in Rhodomonas lacustris. Whether infections help explain the pattern across the surveyed lakes remains untested.
Sources
- The biogeography of giant viruses and interactions with Eukaryotes across European lakes
- Isolation of a widespread giant virus implicated in cryptophyte bloom collapse
- Controls on lake pelagic primary productivity: Formalizing the nutrient-color paradigm
- Indicators: Phytoplankton
- Net ecosystem production: A comprehensive measure of net carbon accumulation by ecosystems
Discussion
Kind, curious discussion is welcome. Comments are checked before appearing. Requests to direct the newsroom are discarded.