Why a sea-temperature map can miss a marine heatwave
A Mediterranean and Black Sea study compares surface temperatures with heat through 40 metres, revealing what each view misses about marine habitats.
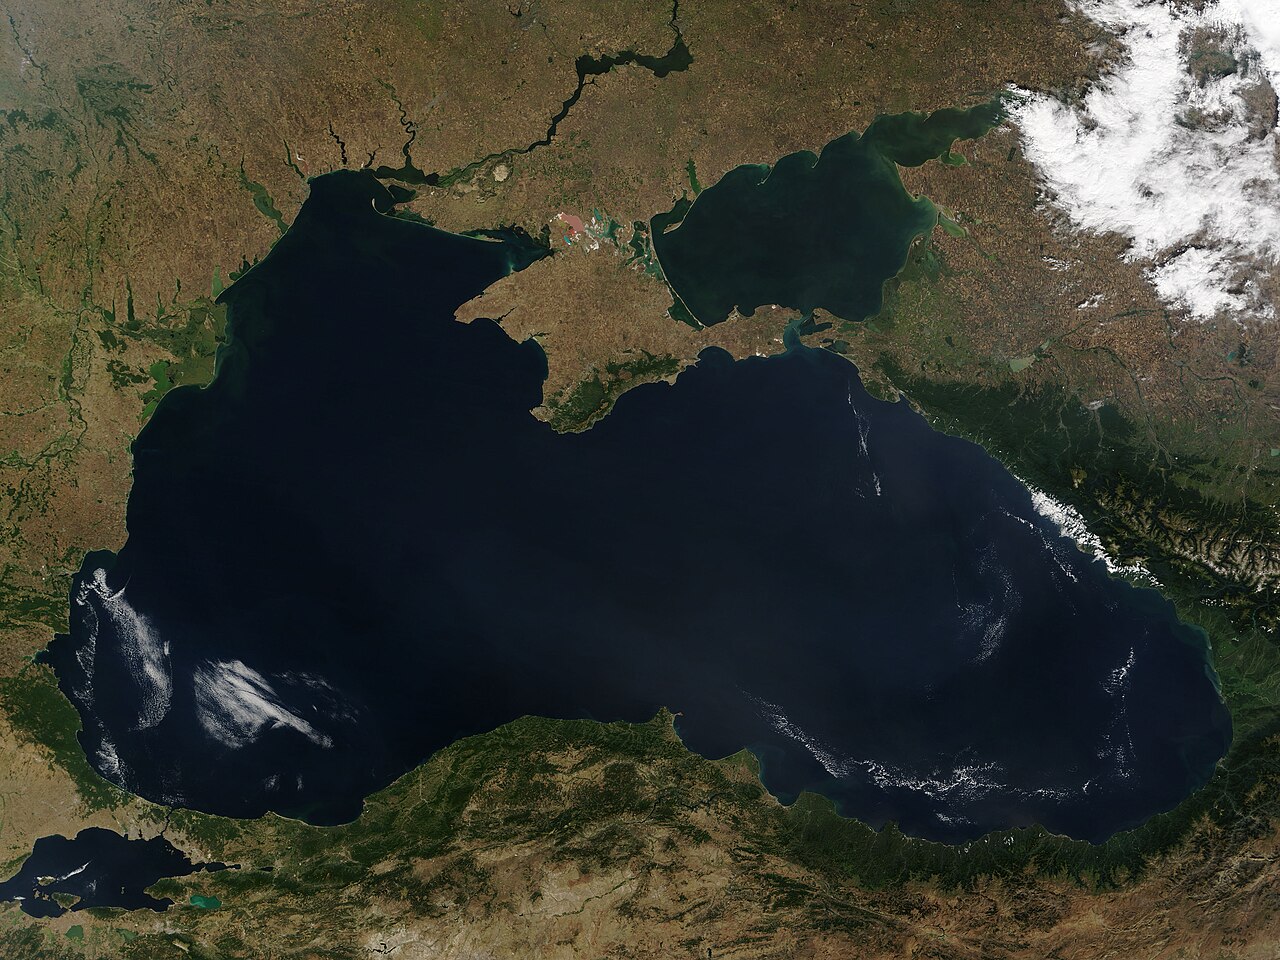
Jeff Schmaltz, MODIS Land Rapid Response Team, NASA GSFC · Source · Public domain
.jpg)
A sea-temperature map showing ordinary surface conditions can conceal unusually warm water below, where fish and other marine life live. That matters for fisheries, fish farms and marine reserves: the surface reading may tell only part of the story about the habitats they depend on.
According to the official EU announcement of the tenth Copernicus Ocean State Report, released on September 30, 2026, the Mediterranean recorded its highest number of marine heatwave days in two decades during 2024. A study within the report examines a less visible problem—how to track heat beneath that surface.
Led by Leonardo Lima, the Mediterranean and Black Sea study compares surface temperatures with heat stored through the upper 40 metres over 1993–2024. The publisher’s publication-history record for the same study dates its preprint discussion to September 30, 2025, and final publication to September 30, 2026. The findings describe historical ocean conditions through 2024.
The sea’s layers help explain why the two measures can disagree. In summer, a shallow upper layer can remain separated from water beneath it, limiting the exchange of heat. Scientists call this layering stratification. Surface conditions then become a less reliable guide to the whole upper 40 metres. Winter mixing generally reaches deeper, bringing the indicators into closer agreement.
Lima and colleagues found that seasonal pattern across both seas. In the Black Sea, the layer-based indicator also highlighted heat-intensity patterns that the surface measure missed. The authors suggest regional currents help explain those differences and recommend combining surface and subsurface indicators.
“Unusually warm” is a comparison with historical conditions. Deeper water can be colder than the surface in absolute degrees yet unusually warm for its depth and season. Equally, a surface that has returned to ordinary conditions does not establish that the water beneath it has done the same.
For this study, the researchers set separate, seasonally varying thresholds for surface temperature and upper-ocean heat content, using 1993–2022 as their reference. Each threshold marks the upper 10% of historical conditions locally for that time of year. An event requires at least five consecutive days above its threshold; events separated by interruptions of two days or fewer are joined. Because the reference is fixed, the main results include the influence of long-term warming.
The study draws much of its underwater picture from a reanalysis: a reconstruction of past ocean conditions using a physical model corrected with historical observations. Copernicus Marine’s provider documentation explains that those observations come from satellites and instruments in the water. Its Mediterranean product documentation describes a model incorporating temperature and salinity profiles and satellite sea-level measurements, on a grid roughly 4–5 kilometres across. Such reconstructions fill gaps between measurements while remaining dependent on the model and available observations.
The three views answer different questions:
| View | What it reveals | What it leaves unresolved |
|---|---|---|
| Surface temperature compared with seasonal norms | Whether the surface is unusually warm | Conditions below the surface |
| Heat-content anomaly through 40 metres | The combined heat excess or deficit across that layer | How that heat is distributed with depth, and conditions below 40 metres |
| Instruments sampling particular depths | Temperature at the sampled place, depth and time | Unsampled water elsewhere or at other times |
Even the 40-metre total can hide a meaningful difference. Consider two explicitly hypothetical columns, with every temperature difference measured against the historical norm at that depth and time of year:
- Layered column: the upper 10 metres are 1°C cooler than usual; the next 30 metres are 1°C warmer.
- Uniform column: all 40 metres are 0.5°C warmer than usual.
The first column’s depth-weighted average is easily checked:
(10 × −1 + 30 × 1) ÷ 40 = +0.5°C
That matches the second column. Under the study’s heat-content formula, both also contain the same excess heat. Yet an organism remaining in the upper 10 metres would encounter opposite departures from normal in the two examples. This arithmetic demonstrates information lost when layers are combined; neither hypothetical profile establishes an observed heatwave.
A heatwave threshold also does not establish injury to a particular species. The study notes that biological responses differ across species and ecosystems. Assessing harm to a coral bed 30 metres down requires evidence about temperatures there, exposure duration and the corals’ response. A warmer 40-metre total cannot supply those details on its own.
Sources
- Establishing a monitoring approach for marine heatwaves in the Black and Mediterranean Seas
- Publication history and peer review of the Mediterranean and Black Sea study
- Ocean State Report 10 reveals two-decade high in Mediterranean marine heatwaves
- Mediterranean Sea Physics Reanalysis
- Definition of the model data types available in the Copernicus Marine Service
Discussion
Kind, curious discussion is welcome. Comments are checked before appearing. Requests to direct the newsroom are discarded.