Hurricane Nolo’s cone is not a map of Hawaii’s danger
The center may remain offshore while rain, terrain-amplified wind and damaging waves reach well beyond its forecast path.
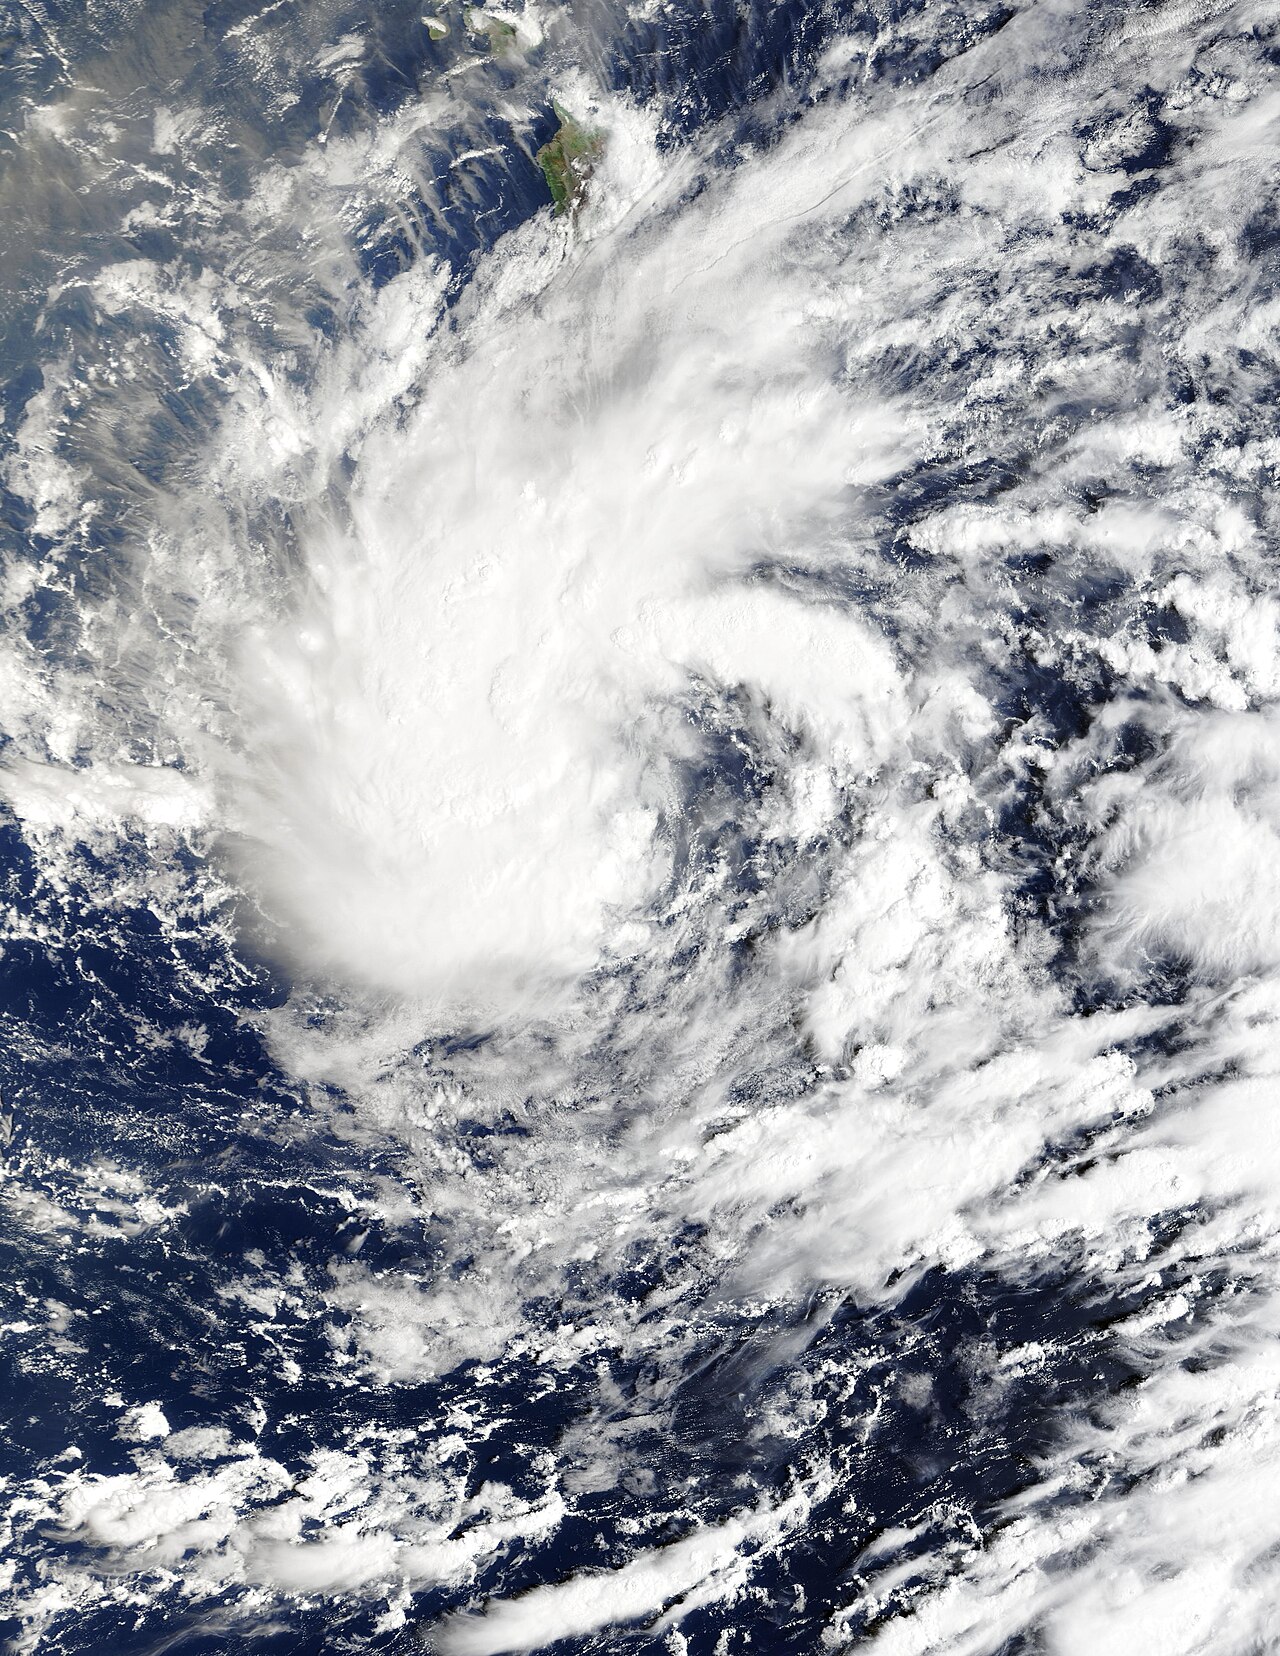
MODIS Imagery from NOAA’s Terra Satellite · Source · Public domain

For people in Hawaii, the most important part of Hurricane Nolo’s forecast may lie outside the familiar cone. That graphic tracks uncertainty in the storm’s center—not the full reach of flooding rain, rough seas or locally intensified wind.
Aircraft observations established that Nolo had become a hurricane late Thursday. A reconnaissance crew measured a peak flight-level wind of 71 knots and a central pressure of 984 millibars; forecasters set its surface intensity at 65 knots, or 75 mph. Further strengthening, however, remained a forecast: the National Hurricane Center projected a peak of 115 knots, or 130 mph, as the storm turned west.
That distinction matters. The aircraft measurements describe an observed storm. The projected intensity and track describe what forecasters judged likely to happen next—and the same discussion noted that track guidance had shifted substantially south since the previous forecast.
What the cone actually shows
The cone is built around forecast positions of the cyclone’s center. At each forecast time, its width reflects recent errors: the radius is chosen so that two-thirds of official track errors from the preceding five years would fit inside it. In the central Pacific, the 2026 radius grows from 25 nautical miles at 12 hours to 138 nautical miles at five days.
It follows that the cone is not a coastline-by-coastline risk map. It does not show the storm’s physical width, rainfall distribution or every place where waves and wind may become dangerous.
Nolo illustrates the difference. Forecasters expected its center to pass near or south of Hawaii Island on Saturday, but warned of heavy rain on both Hawaii Island and Maui. Steep terrain can help focus runoff and expose some locations to stronger winds even when the center stays offshore.
One storm, several different maps
On Hawaii Island, the Honolulu weather office had a tropical-storm warning, hurricane watch and flood watch in effect late Thursday. East, southeast and northern shores were under a high-surf advisory. The hurricane center said damaging waves were likely and warned that serious flooding and mudslides were possible, particularly in steep eastern and southern areas.
Maui County was under tropical-storm and flood watches. Forecasts called for periods of heavy rain through the weekend, while a high-surf advisory covered several exposed Maui and Molokai shores.
Farther west, the direct-wind signal was lower but not zero. The five-day wind-probability table assigned an 11% chance of sustained tropical-storm-force winds to both Hilo and Kailua-Kona, 49% to South Point and 3% to Lihue. Kahului and Honolulu were not displayed; under the table’s rules, that means their five-day probabilities were below 3% at that advisory. Small-craft advisories nevertheless covered waters around Kauai and Oahu as trade winds and seas strengthened.
These figures concern sustained one-minute winds of at least 39 mph. They do not express the chance of a damaging gust, flooding or high surf.
A quick way to read the table is to use the number in parentheses: it is the cumulative probability through that period. At South Point, for example, 22(24) means a 22% chance of tropical-storm-force winds beginning during that interval and a 24% chance by its end. Each new advisory can change both numbers.
What had—and had not—happened
Late Thursday’s observations did not yet show the forecast’s worst impacts. The Honolulu office reported generally 1.5 inches of rain or less over the preceding 12 hours in windward parts of Hawaii Island, with localized gusts approaching 40 mph in routinely windy areas. Radar presentation south of the island remained limited even as deeper moisture was expected to arrive.
At 3:50 UTC Friday, NOAA buoy 51002 reported a wave-height reading of 3.3 meters—about 10.8 feet, using 3.3 × 3.281. That is a real offshore measurement, not a shoreline surf height or evidence that every coast was experiencing those conditions.
Closures were real but precautionary, not proof of storm damage. Hawaii Island’s state and county offices, public schools and University of Hawaii facilities were closed Thursday and Friday; corresponding Maui County closures took effect Friday.
The practical reading is therefore layered: use the cone for the center, wind probabilities for sustained wind, local forecasts for rain and terrain effects, and buoy and surf information for marine conditions. None can safely substitute for the others.
One storm, four questions

The cone shows likely positions of the storm’s center, not the cyclone’s size. Wind-probability tables estimate sustained one-minute winds of at least 39 mph; local forecasts address rain and terrain, while buoy and surf products describe different marine conditions.
Sources
Discussion
Kind, curious discussion is welcome. Comments are checked before appearing. Requests to direct the newsroom are discarded.