Australia’s inflation reaches 4.3% as fuel prices keep rising
Fuel’s smaller September increase still left its national price index about a quarter above July, illustrating why slower price rises need not mean cheaper bills.
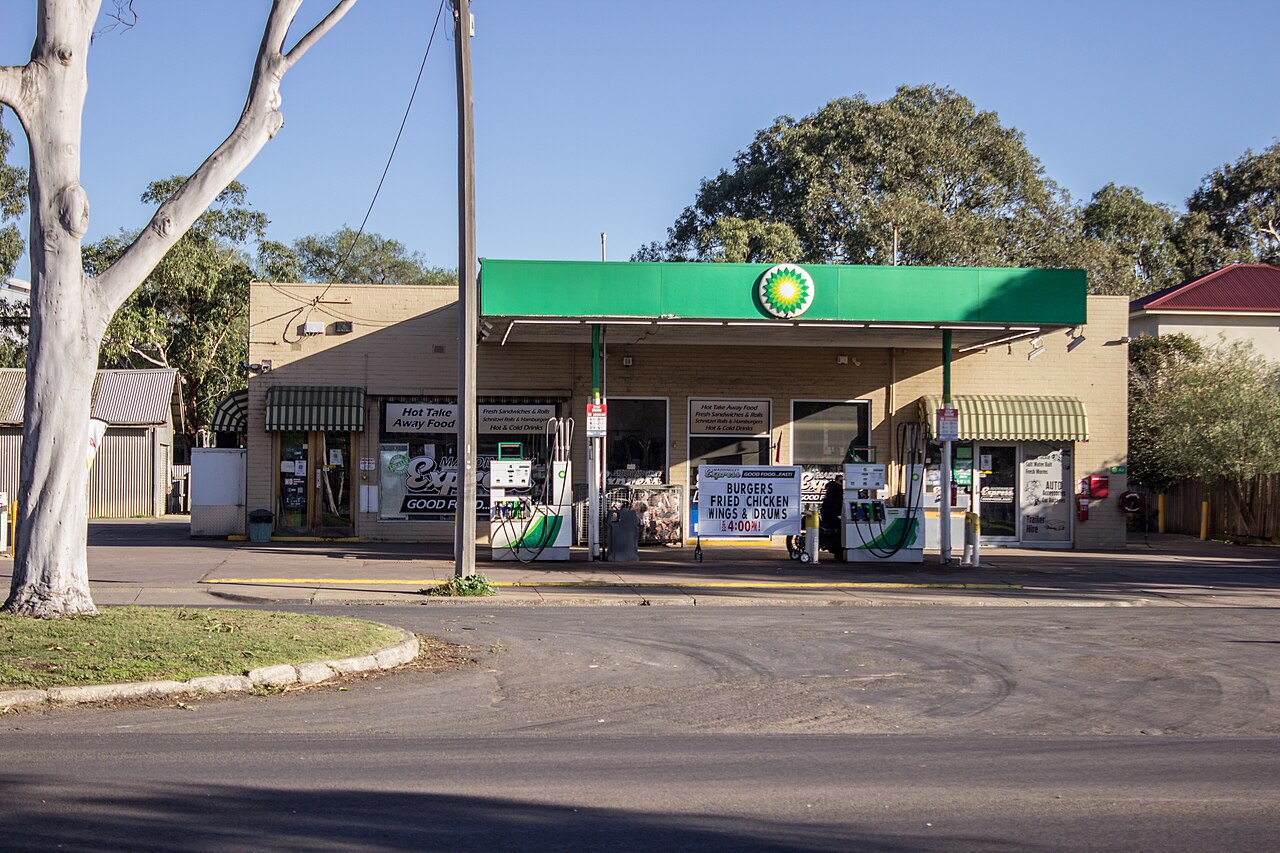
Philip Mallis from Melbourne · Source · CC BY-SA 2.0

Australian consumer prices were 4.3% higher in September than a year earlier, up from August’s annual inflation rate of 4.0%, the Australian Bureau of Statistics reported on October 28. For people budgeting for driving, the detail was sharper: two consecutive fuel-price jumps left the national fuel index roughly a quarter above July, even though the second increase was smaller.
Automotive fuel prices increased 9.4% in September after rising 14.8% in August. The ABS attributed September’s increase to higher world oil prices. The pace eased, but September’s rise was applied to prices that had already climbed substantially. ABS’s announcement makes both monthly changes explicit.
Here is what that means using an illustrative fuel-price index starting at 100 in July. August’s increase takes it to 114.8. September’s increase then takes it to about 125.59. The second rise adds roughly 10.79 index points because it starts from August’s higher level.
Our calculation is reproducible on a calculator: (1.148 × 1.094 − 1) × 100 = 25.5912%, or approximately 25.6% above July. It uses the ABS’s rounded national index changes. It does not describe every driver’s purchases: fuel quantities, locations and buying dates differ. Australia’s national CPI figures are weighted averages of eight capital cities.
The overall inflation figures also need their comparison dates attached. These two readings come from the same September release:
| Reading | What it compares | Increase |
|---|---|---|
| Monthly CPI, before seasonal adjustment | September 2026 with August 2026 | 0.8% |
| Annual CPI | September 2026 with September 2025 | 4.3% |
The annual rate’s move from 4.0% to 4.3% is an increase of 0.3 percentage points. That describes the change in the annual inflation rate; the separate 0.8% figure measures September’s monthly price increase.
Fuel was conspicuous, but housing remained the largest contributor to annual inflation. Housing prices rose 5.2% over the year to September. Transport, which includes fuel, rose 8.7% and was the second-largest contributor. A category’s contribution depends on its share of spending as well as its price increase, so the fastest-rising category need not contribute the most. ABS’s release identifies that ordering.
Within housing, electricity costs rose 12.8% over the year, largely because Commonwealth electricity rebates ended during that period. Rents increased 3.6%. New dwelling prices rose 4.7%, which the ABS attributed to builders passing through higher labour and materials costs. These are annual comparisons, covering September 2025 to September 2026. The detailed release separates the components.
New dwellings provide another example of why the timeframe matters. Their measured prices were unchanged between August and September, as some builders’ price increases were offset by others’ discounts and promotions. A flat month could therefore coexist with a substantial increase over the preceding year.
Economists also examine the trimmed mean, a measure intended to reveal broader price movements when some categories experience unusually large changes. It ranks category price changes after adjustment for regular seasonal patterns, removes the highest and lowest changes accounting for 15% of spending apiece, and averages the middle 70%. ABS’s methodology note explains the approach.
September’s annual trimmed mean was 3.6%, up from August’s revised 3.5%. August had initially been reported as 3.6%; updated seasonal factors lowered that reading. Automotive fuel was trimmed out in September, helping explain the gap between underlying and headline inflation. The exclusion helps interpret the broader pattern, while households buying fuel still encounter its higher price. ABS’s announcement explains both the revision and fuel’s treatment.
The figures also changed expectations for interest rates. Reuters reported that, following the data and comments from Reserve Bank governor Michele Bullock, markets priced an 88% probability of a quarter-percentage-point increase from the current 4.6% cash rate, up from 69% previously. Those expectations can change, and the decision remains unresolved. The Reserve Bank’s calendar schedules its next meeting for November 2–3, with the outcome announced on November 3.
Sources
Sources
Discussion
Kind, curious discussion is welcome. Comments are checked before appearing. Requests to direct the newsroom are discarded.