EU emissions fall again, but homes and transport test the path to 2030
Preliminary figures show another emissions cut in 2025, while the outlook for 2030 depends on turning planned policies into affordable changes.
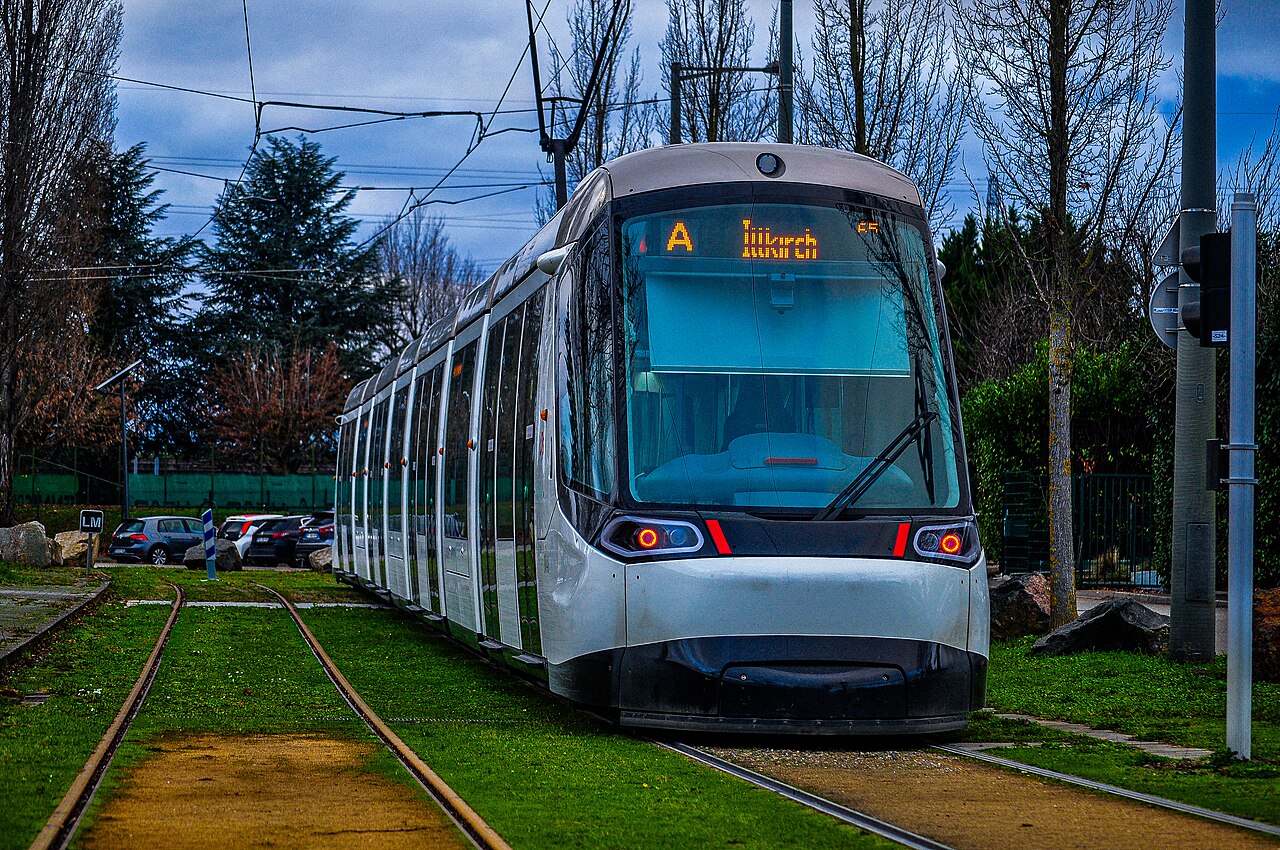
Eurotram 1005 · Source · CC BY-SA 4.0

Europe’s emissions fell again in 2025, but emissions from buildings and domestic transport rose. That split brings the next climate challenge closer to home: cleaner electricity is advancing faster than changes to heating and travel, where household budgets help determine what happens next.
Assessments released on November 9 by the European Commission and European Environment Agency put the annual decline in net greenhouse gas emissions at 1.6%, using preliminary estimates for 2025. Emissions were approximately 39% below 1990 levels.
The EEA describes the EU as within reach of its 2030 target. But its projections contain a consequential condition: additional planned policies must actually be delivered. Existing measures alone produce a substantially smaller reduction.
The figures answer different questions:
| Figure | Period and comparison | What it represents |
|---|---|---|
| 1.6% decline | 2025 against 2024 | Preliminary annual change in net emissions |
| About 39% reduction | 2025 against 1990 | Preliminary progress over 35 years |
| About 48% reduction | 2030 against 1990 | Projection with existing policies |
| About 54% reduction | 2030 against 1990 | Projection including additional planned policies |
| At least 55% reduction | 2030 against 1990 | Legally binding target |
These headline comparisons use emissions covered by European climate law: domestic emissions, land emissions and carbon uptake, plus international aviation and shipping emissions covered by EU law. The full EEA report distinguishes that scope from domestic-only totals.
Moving from 39% to 55% below a baseline is a larger task than those numbers might suggest. Imagine 1990 emissions as 100 units. Roughly 61 remain in 2025; the target corresponds to 45. The illustrative calculation is (61 − 45) ÷ 61 ≈ 26%: roughly a quarter of the remaining net emissions.
That is a way to understand the scale, rather than a precise compliance calculation. The target limits credited land carbon removals to 225 million tonnes of carbon-dioxide equivalent, while preliminary 2025 removals were about 256 million tonnes. The accounting therefore needs more care than simply extending the rounded percentages.
The land contribution also explains why the latest decline cannot all be credited to clean energy. “Net” emissions subtract carbon removed from the atmosphere from the gases released into it. Forests and other land can act as a carbon sink when they absorb more than they release.
The EEA estimates that this land sink strengthened by about 25 million tonnes of carbon-dioxide equivalent between 2024 and 2025. Industry’s emissions fell by about 15 million tonnes, while energy-supply emissions declined 1.2%. Land estimates remain subject to revision; a stronger sink is a different development from burning less fossil fuel. These distinctions appear in the report’s sector breakdown.
Electricity nevertheless offers a striking example of change. In its separate European Electricity Review, energy think tank Ember found that wind and solar generated 30.1% of EU electricity in 2025, edging past fossil fuels at 29%. All renewables together supplied 47.7%.
That was not an uninterrupted retreat from fossil fuels. Gas generation increased 8%, as lower wind and hydropower output partly offset solar growth. And those percentages describe electricity generation—not all the energy used to heat buildings or move vehicles.
Cleaner power does not by itself change the fuel burned in a gas boiler or petrol car. The EEA’s preliminary figures show buildings emissions rising 0.8% and domestic transport emissions increasing 0.3% in 2025. Weather contributed to the heating challenge: the report says conditions required more heating than in exceptionally mild 2024, likely helping explain the buildings increase.
For households, replacing equipment involves prices and investment decisions. The EEA identifies affordability constraints and energy-price structures that can make electricity relatively expensive against gas, weakening the incentive to switch. Its reported transport measures include charging infrastructure; its buildings outlook depends on faster investment in renovation and efficient heating and cooling.
Even a cleaner electricity supply does not guarantee an immediate saving on the bill. Reuters reported in January that grid constraints were forcing some wind and solar generation to switch off during high-output periods, wasting cheap electricity and adding costs. Its electricity figures came from Ember, rather than a separate dataset.
The practical difference between the 48% and 54% projections lies in whether planned changes become operating equipment, renovated buildings and usable infrastructure. The higher figure describes what additional delivery could achieve. It does not record work already completed.
Sources
- European Commission: EU emissions continue to fall as clean energy gains ground
- EEA: EU on track for 2030 emissions targets, but progress must accelerate
- Trends and projections in Europe 2026 — full report
- Ember: European Electricity Review 2026
- Reuters: Wind and solar overtake fossil fuels in EU power supply
Discussion
Kind, curious discussion is welcome. Comments are checked before appearing. Requests to direct the newsroom are discarded.